A watchtower for your production apps
A page loads.
But does the journey work?
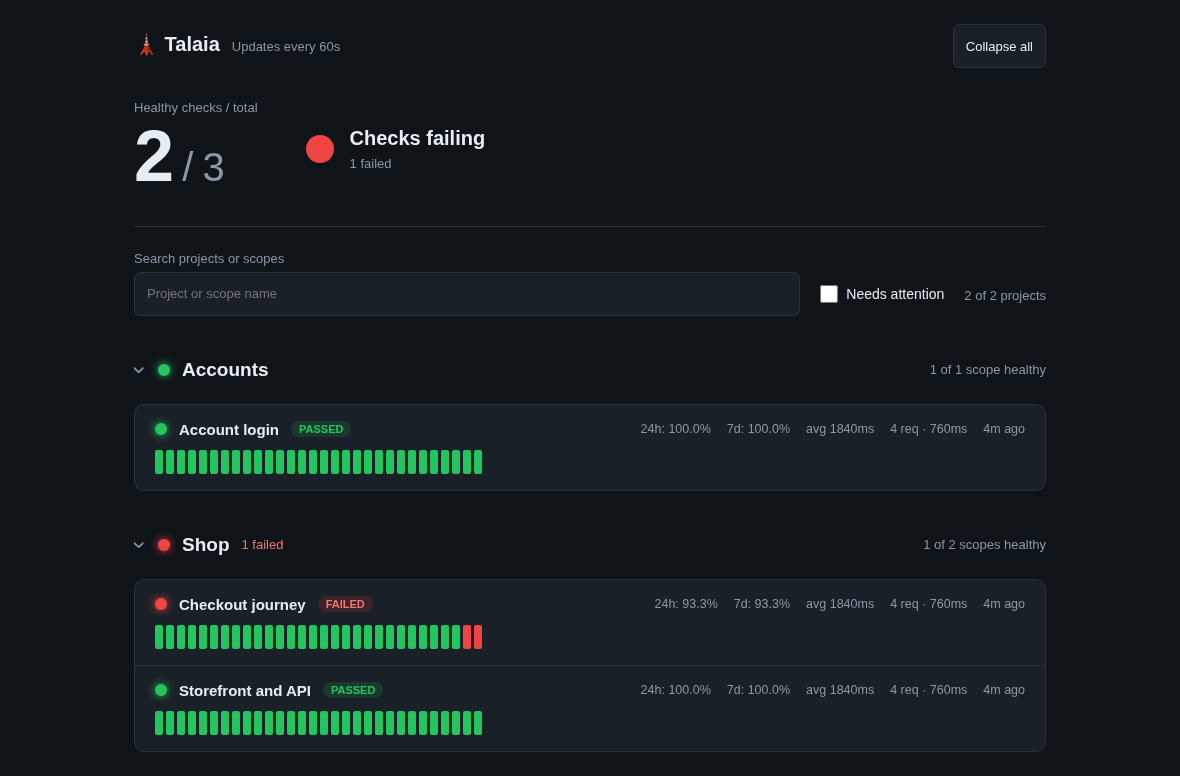
Talaia runs the smoke tests you write against your live apps. Check an API, complete a test-account login, or follow a browser journey. See which checks failed, and get an alert that matches their importance.
For developers operating their own production apps. Contact Oriol to discuss access and deployment.
From a test
to a useful signal
Plain pytest. A schedule you control. A record of what happened.
Define what working means
Start with a public health endpoint and a product-specific page marker. Add httpx API tests or Playwright journeys when you have a dedicated test account. A shell check proves the shell loads; a login test proves login works.
Run it on a measured schedule
Each suite defines its cron schedule, timeout and request budget. The runner records results, retries and footprint in SQLite. Detection happens on scheduled checks, with retries or confirmation before an outage alert.
Choose what should interrupt you
Choose normal, high or emergency Pushover priority per suite. Persistent failures get cooldown reminders. Recovery gets a normal notification and stops emergency repeats.
Give a brief outage
a minute to recover
For emergency suites, a failed attempt starts a 60-second wait. Talaia then reruns the suite once. A recovery earns a normal short-outage warning; a second failure earns an emergency.
Read the alert policyExample: checkout is set to emergency
- First attempt fails
Wait 60 seconds, then run the same suite again.
- If it passes
Normal priority 0: “Short outage recovered.”
- If it still fails
Emergency priority 2, with repeats until acknowledged, expired or cancelled on detected recovery.
Default emergency repeats: every 60 seconds for up to 30 minutes. Configuration errors stay low priority.
Small enough to understand.
Useful across your fleet.
- Run history you can inspect
- A read-only status UI with recent results, failure details, uptime samples and stale-check indicators. SQLite keeps history and alert state in a persistent volume.
- A budget for monitoring itself
- Measure synchronous httpx calls and browser HTTP requests, including redirect hops and request time. Budgets warn if a suite costs too much. The docs explain limits for caches, failed responses and other unmeasured traffic.
- Fits your existing monitoring
- Prometheus metrics, an optional InfluxDB mirror, and optional Healthchecks.io heartbeats so a stopped scheduler is visible outside Talaia.
- Production tests need boundaries
- Use dedicated test accounts, explicit safety gates and SMOKE-prefixed data with cleanup where possible. Reviewed flows that leave permanent data run infrequently. Suite authors own these rules; arbitrary pytest code is not sandboxed by the runner.
Roadmap · not implemented
Living Specs
Describe a browser test in plain language. The planned workflow turns your intent into a reviewed plan and deterministic Playwright code, then proposes repairs when mechanics drift.
Intent assertions stay unchanged. Generated code requires review before scheduled execution. The current product runs handwritten pytest; generation and healing remain in design.
Explore the designWhat should your next check prove?
Discuss access with Oriol, or read the setup guide if you already have the project files.